http://www.istl.org/06-winter/refereed2.html
Using Spreadsheets to Map a Library Reclassification, Reorganization, and Merger
Information Services Librarian
Natural Sciences Library
University of Washington
swright@u.washington.edu
Nancy Blase
Head, Natural Sciences Library
University of Washington
nblase@u.washington.edu
Abstract:
With the approaching merger of two university branch libraries, library staff took the opportunity to reclassify and reorganize the collections being integrated. The materials were reclassed from Dewey Decimal to Library of Congress, and the books and periodicals were integrated from separate shelving areas into one continuous call number sequence. The library remained open and maintained normal service levels throughout the process including during the merger itself. This case study details how an academic science library found spreadsheets to be superbly versatile and valuable for manipulating and visualizing data -- from planning through implementation.
Introduction
Most articles discussing the potential of spreadsheets to aid in library planning were written in the late 1980s to early 1990s. Even then, the ability of electronic spreadsheets to facilitate manipulation of large quantities of data was recognizable. Some articles focused on the potential of spreadsheets to aid in calculations of library stock (Smith 1990); others discussed collection reorganizations (Abbott 1990), integrations (Bayne 1990), or library moves (Compton Ellis 1988). Spreadsheets are especially useful when it comes to planning reorganization of library materials, because "planning a move is an arithmetical operation. The computer technology which is best designed to handle arithmetic is the spreadsheet" (Tucker 1989). Software applications have progressed far ahead of what they were a decade ago. Their ability to assist in the planning of a library move has evolved beyond mere number crunching. The library move discussed in this article was essentially three projects in one: a reclassification, an intralibrary integration, and an interlibrary merger. Spreadsheets kept library staff from reinventing the wheel each time data needed to be manipulated, though it was the software's ability to assist in the visualization of data that proved to be the most useful.
The Libraries
The University of Washington Libraries system consists of 26 branch libraries and collections. Traditionally, it is ranked among the top 15 research libraries in North America and in 2004 it was the recipient of the Excellence in Academic Libraries Award for top university research library in the country.
Ten years ago, shrinking library budgets became the norm while more information became available electronically. In response, a Libraries task force submitted a proposal to merge libraries housing similar subject areas. In 2003, after years of significant budget cuts and with assessment surveys indicating increasing use of online services, the Libraries decided to merge the Forest Resources Library (FRL) collection into the larger Natural Sciences Library (NSL).
The Forest Resources Library was located in the basement of a College of Forest Resources building near the south end of the campus. The collection of 53,000 books and periodicals, with subject areas ranging from agriculture to wood technology, experienced a 40% decrease in use over the previous seven years. The Natural Sciences Library, centrally located on campus, had a collection of approximately 250,000 books and periodicals covering a wide range of science subject areas from atmospheric sciences to zoology. With the decision to merge came the opportunity to evaluate the organization and layout of the planned integration.
Reclassification of Dewey to Library of Congress
A number of articles and books describe the change, especially in United States and Canadian academic libraries, from the Dewey Decimal Classification System (Dewey) to the Library of Congress Classification System (LC). Although most covered full collection reclassifications, others focused on reasons for the reclassification (Chressanthis 1995; Dean 1984); sources and techniques for getting new call numbers (Lewis and Seago 1999; Pattie 1995); and reclassification costs (Massonneau 1990; McMillan and McMillan 1984). Regardless of classification system used, there has also been an ongoing debate as to whether periodicals in science libraries should be classified at all or simply shelved by title (Roth 1980). Though there are some science libraries on the University of Washington campus that shelve their periodicals by title, the Natural Sciences Library has always shelved its periodicals by call number. Similar to other academic libraries which changed to LC for newly catalogued items (Chressanthis 1992), the UW Libraries stopped assigning Dewey numbers to new monographs and periodicals in 1967. Ongoing periodicals and monographic series, however, continued to be classified as Dewey.
In 1990, the NSL moved to its current location with two floors. Dewey books were shelved on the Ground Floor and LC books and Dewey and LC periodicals occupied the First Floor. Thus, a user seeking materials on a particular subject potentially had to go to four places to find everything. The decision to merge provided an opportune time to integrate the books and periodicals into one collection. It was also an ideal opportunity to reclass all Dewey periodicals and monographs that would continue to be shelved in the active collection. All Dewey items not reclassed would be moved to storage.
Periodicals
A list of all Dewey and LC periodicals, complete with the number of physical volumes for each title, was created through our integrated library system (Innovative) and exported into a spreadsheet using Microsoft Excel 2002. Over a period of three months, every title was measured and the data entered into the spreadsheet. This "All Periodicals" spreadsheet was split into two separate spreadsheets: one for active Dewey periodicals (296 titles), and one for "dead" Dewey periodicals (those that were no longer continuing -- ceased, canceled, changed title, etc.). The "active Deweys" spreadsheet [Figure 1] was sorted by number of volumes, with the least number of volumes (1 volume) first and the largest set (1,645 volumes) last, since we planned to reshelve reclassed titles into their new LC location as soon as they were relabeled. We assumed, correctly, that the smallest sets of active titles would be easiest to shelve in the available space. For these titles, the UW Libraries Database Management Section (DMS) recommended the appropriate LC call number and inserted it into the shared Excel file.
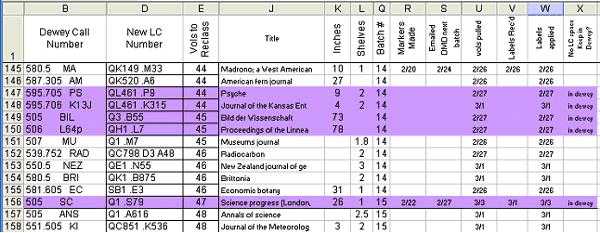
Figure 1 -- "Active Dewey Titles" spreadsheet
Library staff requested DMS to produce call number labels and to update the online catalog records for batches of 10 to 20 titles at a time. After receiving the call number labels printed by DMS, volumes were pulled from the shelves, labels were applied, and items were then shelved in their appropriate LC locations. To help library users and staff find materials in the continually shifting collection, information sheets with old and new call numbers, as well as title, were created for each reclassified periodical and inserted into the stacks at both the LC and the Dewey shelving locations.
The volume sets quickly got larger and all staff, student assistants and librarians pitched in to relabel. It soon became more challenging to find space in some call number areas to shelve all volumes without a lot of shifting. We left some titles in their old Dewey locations adding "Still shelved as: [Dewey call number]" to the information sheets and to the library catalog [Figure 2] (Beatty 1987).

Figure 2 - "Shelved as" notation in catalog
Once the active titles were completed, decisions needed to be made for all the "dead" Dewey periodicals. Subject selectors were given the titles within their subject call number ranges and asked to make the choice of whether to reclassify a title or place it in storage. The decisions were added to the appropriate spreadsheet and, using the filtering feature of Excel, a new spreadsheet was created including only the titles to be reclassed. With few differences, reclassing procedures for the "dead" titles proceeded as they had for the active titles.
Although we began relabeling titles having the fewest number of volumes, we soon determined with the LC shelves much more full with reclassed active titles, it would be better to relabel the inactive ones in LC order. The spreadsheet was easily re-sorted to accommodate this change. As relabeling progressed, it was decided that rather than constantly shift in the LC stacks to make room on fewer and fewer shelves, every title would henceforth be shelved in its original Dewey location and designated in the online catalog as: "Still shelved as: [Dewey call number]."
Monograph Titles
The primary criterion for selecting monographs for reclassification was how many times they had circulated. Each title that had circulated three times or more within the last 10 years was preliminarily designated to be reclassed. A list was created in Innovative and exported into a spreadsheet, including the call number, number of checkouts and date of last checkout for each Dewey monograph in the collection. Items with three or more checkouts were automatically given a value of "1" for "reclass." Items which circulated less were given a value of "0" indicating they could be sent to storage [Figure 3]. Selectors double-checked and refined the reclass vs. storage decisions in their subject areas. Excel's conditional formatting feature was used to automatically color code the cells when a selector changed a decision, to make it more readily visible.
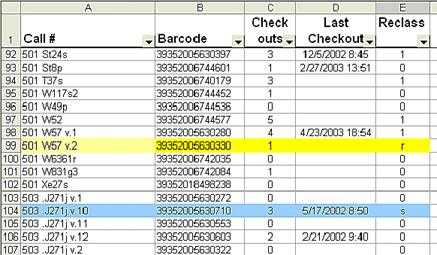
Figure 3 - Dewey monographs spreadsheet
After the decisions had been made, a library technician and one librarian were trained to assign LC numbers and determine which monographs should instead be referred to DMS for LC number assignment. They changed the number in the catalog, printed labels and applied them. Although nearly all the books were able to be shelved immediately in the LC book stacks, those that could not were placed in a temporary semi-public area with a location notation in the catalog.
Integrating Books and Journals
Once all Dewey items had been either reclassed or moved to the storage facility, it was time to start shifting materials to their new shelving locations. There were two objectives to keep in mind: 1) integrate the book and periodical collections, and 2) create space for the incoming Forest Resources collection which, thankfully, already had books and periodicals integrated.
Calculating Space
To avoid moving the Natural Sciences materials more than once, we left space for the Forest Resources material while we were shifting books and periodicals to fit our new call number arrangement. Our challenge here was to determine where the FRL materials were going to be shelved within the NSL collection. We also wanted to make it clear where the FRL titles should be placed on the NSL shelves since the hired movers were from an outside source and not trained in call number order.
Before the collections could be shifted, we needed to determine the total amount of shelf space occupied by the NSL and FRL collections, as well as growth space for both, needed to be determined. As mentioned above, the shelf space occupied by all the NSL periodical titles had already been measured and entered into the "All Periodicals" spreadsheet. Using that data and the "Dead Deweys" spreadsheet, a new "Selected Periodicals" spreadsheet was created for just those materials remaining in the active collection [Figure 4]. The new spreadsheet had columns for old Dewey call numbers, new LC Call numbers, inches, shelves, cumulative shelf data (shelf space of the title in units of shelves), and notes.
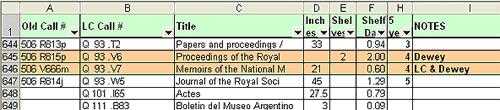
Figure 4 – "Selected Periodicals" spreadsheet
Growth was calculated for all active periodical titles by measuring the shelf space occupied by five years of each title. This data was entered in a new column added to the "Selected Periodicals" spreadsheet. Reclassed titles still "Shelved As Dewey" were noted and color-coded. With this information, we now knew how much total space the Natural Sciences periodicals were going to occupy over the next five years. With the sort and filter capabilities of Excel, the data was manipulated to specify how much space each periodical subject classification would consume.
To measure each periodical title was one thing but to understand how much space the book collection would take up, and how much growth space per shelf was available, a broader approach was needed. On a walk through the stacks, notes were taken on how many shelves each subject class occupied (e.g., Q, QA, QB, etc.). To figure growth, another list was created through Innovative for new monograph acquisitions in the past year. In this manner we were able to estimate how much space, including growth, would be needed by each broad subject classification.
The Forest Resources Library did not have the personnel to obtain as much detailed data as was collected by NSL since it had a much smaller staff. To estimate space required by the FRL collection, the Create Lists function in Innovative was used to export a list into Excel of all Natural Sciences call numbers and all Forest Resources call numbers, each broken down by LC double-letter class level. Separate columns were used for the different parts of the call number to facilitate sorting in Excel. By merging the call numbers for both collections into one spreadsheet and color-coding by collection, we could visualize where large chunks of Forestry materials would be integrated into the Natural Sciences collection [Figure 5].
To determine how much space each "chunk" of Forestry materials would occupy, we first came up with the average size of a Forestry item. To do that, the total amount of shelf space each broad subject class occupied in the Forest Resources Library was divided by the number of items in that subject class (as indicated by the number of call numbers in our list). Using this formula, there was a different average for each broad subject class, and the average was more accurate within that class. Taking advantage of the filtering and "auto-fill" features in Microsoft Excel, every Forestry call number was given the value for that average.
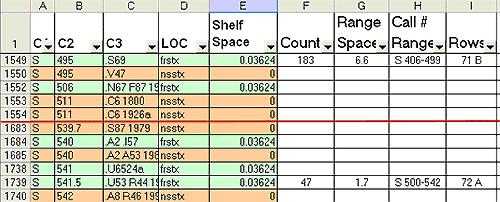
Figure 5- "FRL & NSL Integrated" spreadsheet
Color coding FRL and NSL call numbers on the integrated spreadsheet identified uninterrupted ranges of FRL call numbers that appeared to occupy at least a shelf of space (sometimes hundreds of shelves in subject areas unique to FRL). By clicking and dragging through the "Shelf Space" column for each identified range of items and using the "COUNTA" function in Excel (which counts cells that are not empty), it was easy to count the number of Forestry items within the highlighted range. In the next column, we used the formula "Shelf Space" multiplied by "Count" = "Range Space" to determine the amount of shelf space the FRL call number range would occupy.
Mapping
Placing all this data in an "Overview" spreadsheet, along with growth estimates from FRL staff, enabled us to create a running shelf total for each broad call number range [Figure 6]. The running total determined where the call number break for the collection would be between the two floors. With this information we determined that A-QD would be on the Ground Floor and QE-Z on the First Floor.
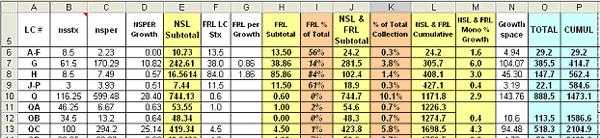
Figure 6 - "Overview" spreadsheet
To make it easier to visualize where call numbers were going to fall in the new arrangement, the running total from the "Overview" spreadsheet was used as a guide for a new spreadsheet created to construct a visual map of the library with each row, section, and shelf numbered [Figures 7 and 8]. We used the natural grid format of the spreadsheet to replicate the "grids" created by bookshelves. Using the Borders feature in Excel, the shelf ranges were outlined and a map was created with each numbered cell representing one shelf. The map was then color-coded to indicate which call numbers would occupy what shelves. Shelves reserved for growth space were not numbered, nor were shelves permanently set aside for items to be reshelved. This map was helpful in showing what the library would look like at the end of the move and as a useful guide to double-check our spacing while we shifted.
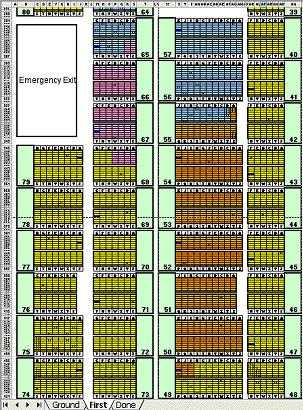
Figure 7 – "Shelving Map" of First Floor
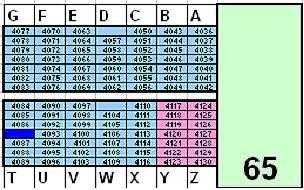
Figure 8 – Detailed view of a row
Once we began the major shifting, the biggest problem we faced was attempting to integrate and reorganize the materials onto shelves that were already occupied. The integration also had to be done in such a manner that staff and library users could still locate the items they needed. To get a better idea of how things would need to be shifted, we walked through the stacks with a basic floor plan and noted what call number ranges occupied each section in every row of shelving.
With the reclassification or storage of the Dewey monographs, all of the Natural Sciences Ground Floor shelving had been left empty. While this was plenty of space for A-QD materials, the First Floor did not have enough surge space in the necessary places to shift QE-Z materials onto their appropriate shelves.
Using the annotated floor plan, a "Book Shuffle" map was created with an Excel spreadsheet [Figure 9]. This time, each cell on the map represented one section of shelving in a row. By counting and color-coding the cells, we could virtually move sections of materials around in the spreadsheet and come up with various shifting scenarios. Blue cells indicated empty sections; red cells indicated shelves where materials had been integrated and were in new permanent locations; orange cells represented sections from which materials were being moved for that phase; and pink cells indicated the sections to which those materials were being moved. White cells were for sections where materials were still in their original locations.
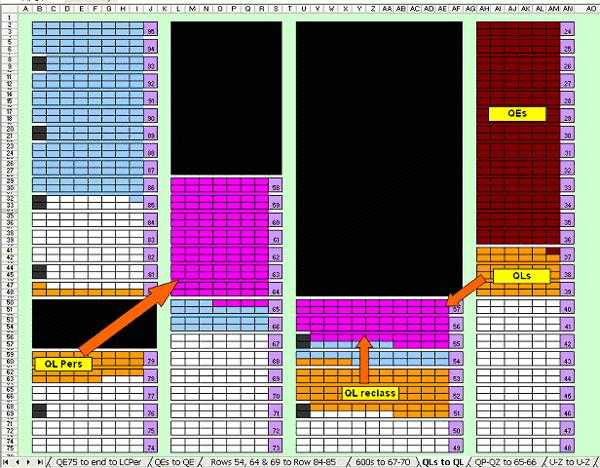
Figure 9 - "Book Shuffle" worksheet for QLs
Every scenario was created with multiple worksheets, each tabbed sheet visualizing a different phase in the integration process. By clicking on the worksheet tabs, one could see how the entire shift would progress. Through the use of the "Book Shuffle" map we were able to create several scenarios and discovered that by compacting the materials we planned to move to the Ground Floor, there was shelving left over to use as surge space so we could effectively shift and integrate the materials on the First Floor. After the First Floor materials were completely shifted and integrated, growth space could then be added to the A-QD materials, thus using all the Ground Floor shelves. There are other software programs designed to do such graphic representations, such as CAD programs and the British Library's Book Control System (Greenwood and Shawyer 1993), but 1) the library didn't own them, 2) our staff was not trained to use them, and 3) we already had the floor plan in Excel. Through the use of multiple worksheets, Excel was able to provide the visualization needed, simply and effectively.
It was all well and good to have the process in a format the planning committee could understand but there also needed to be a step-by-step timeline all staff could follow to understand which steps had been completed and what was left to be done. To that end, a "timeline" was created [Table 1]. The timeline included tasks, rows involved, start and end dates for each task, and any special notes about individual tasks. Since the growth needs for each subject classification had already been calculated, we were also able to include a column with the number of inches to be left at the end of each shelf, for every call number range being shifted. This timeline ended up being invaluable throughout the process, since shifting progressed during most hours the library was open. With each step laid out carefully, it was much easier to hand over supervision as personnel went on and off duty.
![[Table]](http://www.istl.org/06-winter/refereed2-img1.jpg)
Table 1- Merger timeline
Shifting
Now that the plan was in place, a procedure was needed for carrying it out. Given that materials were being integrated from multiple locations (the book stacks, LC periodical stacks, and the Dewey stacks with periodicals labeled LC but still "Shelved As Dewey", as well as the FRL collection), it was necessary to make one collection the "base collection" and use flags to indicate where materials needed to be inserted from other NSL and FRL locations. It was only logical to make the NSL book collection our "base collection" since, 1) it would be much easier to create flags for each periodical title rather than a flag for every book, and 2) we already had a list of all the periodicals and FRL space measurements in spreadsheets. For the periodicals, yellow flags with the LC call number (and old Dewey call number for reclassed items), amount of shelf space, and growth space needed at the end of active titles were used. Blue flags indicated the space needed for FRL materials. FRL flags included the call number range and number of shelves to be left empty. The differently colored flags made it easy to tell at a glance from which location the materials were being inserted, and whether periodicals were to be inserted or shelves were to be left empty. Using the spreadsheets as a data source, Microsoft Word's Mail Merge feature expediently printed the flags with the exact information needed. Once the flags were printed, they were inserted into the NSL book collection to act as markers indicating where materials were to be integrated. The blue FRL flags, representing whole ranges of call numbers, were inserted at the beginning of the call number range represented.
Books were removed from their shelves and placed directly onto book trucks in call number order, with the yellow periodical and blue FRL flags still inserted. At the same time, other library staff members were using "pull lists" generated from the "Selected Periodicals" spreadsheet to integrate and load both the LC and "Shelved As Dewey" periodicals onto machine trucks (large plywood book trucks designed to hold approximately six shelves of material).
As library staff shelved the books in their new locations, the flags served as notification to stop unloading from the "book" truck. When shelvers came to a yellow periodical flag, they would insert the indicated volumes from a machine truck. The flag was then inserted at the end of the periodical run, and the shelvers went back to unloading the "book" truck. For an active title that needed growth space, the amount of space printed on the flag was left empty on the shelf before shelvers continued unloading materials from the "book" truck. When a blue FRL flag was encountered, they left empty the number of shelves indicated on the flag, then taped the flag to the shelf so it was visible from the end of the row.
If shelvers came across a yellow periodical flag that did not have corresponding material on the machine truck, a search was placed on that particular title. Standard operating procedure was to leave the amount of shelf space indicated on the flag and tape the flag to the shelf for later review by a supervisor. Supervisors reviewed the shelves on a regular basis to pull yellow flags and to make sure the appropriate amount of growth space had been left after active periodical runs.
The shifting of the entire collection took seven weeks and four days, with teams ranging from two to eight people working an average of nine hours a day. This part of the project was completed one week before the items were scheduled to be moved in from the Forest Resources Library.
Integrating FRL
For the professional movers and library personnel alike, we had to clearly identify where materials from the Forest Resources Library were supposed to be shelved. We walked the stacks looking for blue FRL flags and noted in the "FRL & NSL Integrated" spreadsheet the numbered row(s) for each call number range where space had been left.
As before, Mail Merge was used to create flags, this time on pink paper, indicating in which specific rows the FRL materials in each call number range needed to be shelved. These flags were inserted into the collection on the shelves in the Forest Resources Library prior to the arrival of the movers. The moving team at the Forest Resources Library unloaded materials (with flags) from the shelves onto large "machine" trucks. Library staff numbered the trucks so moving personnel in the Natural Sciences Library would know in what order to shelve the material when they received the trucks. This was particularly crucial when the range of materials between flags spanned across trucks.
The moving team at the Natural Sciences Library used the pink row location flags to determine in which row the material needed to be shelved. Once in the correct row, they looked for the corresponding blue FRL flag taped to the appropriate shelf. The pink flag at the start of the range of materials on the machine truck was inserted at the beginning of the empty space on the shelf. All the materials between that first pink flag and the next pink flag on the truck were shelved. The blue FRL flag taped to the shelf was inserted at the end of the range of Forest Resources material to which the flag corresponded. The process was repeated with the next pink row location flag.
The move of the materials from the Forest Resources Library to the Natural Sciences Library took two and a half days. After all the materials were placed on the appropriate shelves, library staff proficient in call number order integrated the materials shelved in-between the pink and blue flags into the surrounding collection. Over the next three weeks, a small crew completed the integration of Forest Resources materials as time allowed.
Communication
Since every phase of the move and merger was carried out while the library was open, one of the highest priorities was to maintain the service level for all users. Throughout the project, the need to keep staff and users informed was paramount. For staff, several methods of communication were used to keep everyone up to date. Copies of the project timeline were given to Circulation and Reference Desk staff. A daily log was kept in a spiral notebook where supervisors "on call" could leave detailed notes on specific progress made for every hour of the day. Notes included who was on the shifting teams, what tasks were completed, problems encountered, etc. Library staff outside the unit were kept informed through updates via the UW Libraries weekly online newsletter.
Some methods of communication provided to library users have already been mentioned, such as "Shelved As Dewey" notations and cross-referencing sheets in the stacks. Other resources included the NSL web site, which was updated on a regular basis to keep users informed about areas of the library that had been moved and which were currently being shifted. For those who visited the library in person, laminated floor plans created from the "Shelving Map" spreadsheet were color-coded with dry-erase markers at the end of every day to indicate where shifting had taken place (Beatty 1987). Smaller 8 ?x 11 maps were kept at the Circulation and Reference Desks while larger 11 x 17 maps were posted at the entrances to the library.
Budget
Overall expenses for the merger included those incurred for the reclass, moving materials to storage, shifting volumes, and shelving materials relocated from the Forest Resources collection. Estimates were based on two categories: 1) direct costs for student/hourly employees, a merger manager (0.8 FTE), new shelving, security stripping, and professional movers, as well as, 2) hourly and permanent employees (including librarians) who worked on project-related tasks at the same time as, or in place of, other assigned duties. The budget, done on Excel, was easily converted after project completion to an "actual costs" document showing the estimated direct costs to the side, as a comparison. The merger, which took 10 months, cost just over $56,000.
Summary
As with any major project, there were minor glitches and miscalculations, though for the most part all the measuring and planning paid off. The merger was finished on time and slightly under budget. Though locating materials took a bit more time than usual for staff and library users during the project, we did not receive any formal complaints. When users returned from summer interim, they were surprised that everything was in a different place however the response was positive. We received encouraging comments regarding the integration of books and periodicals, as well as the single classification system.
While the project progressed smoothly overall, in hindsight there are a few things that could have been done differently. Supplementing the "Shelved As Dewey" notations in the catalog with the exact row number where the materials were shelved would have enabled library users and staff to find materials more easily. We also wish we had consulted more of the available literature prior to the planning process. Though this project was somewhat unique in that it was essentially three major projects done sequentially, each sub-project was one that had been tackled and written about before. We would have been able to avoid duplication of brain power if we had read through the experiences of those who had traveled the road ahead of us. Hopefully, our experiences will be helpful to those who follow.
Acknowledgements:
This article (and the project) would not have been possible without the ongoing support of so many people throughout the UW Libraries. A special thank you goes out to Susan St. John for her literature review and to Chery Kinnick, Stephanie Lamson, Eileen Llona, and Maureen Nolan for their untiring eyes and editing skills.
References
Abbott, C. 1990. Using Excel at Aston University Library and Information Services: the application of spreadsheets to library. Program. 24 (3):269-279.
Bayne, P.S. 1990. The 'Do-it-yourself' move for a 1.5 million-volume library. College and Research Libraries. 51 (1):55-67.
Beatty, S. 1987. DDC to LCC in eight weeks. Cataloguing Australia. 13 (3):92-100.
Chressanthis, J.D. 1992. The mechanics of a reclassification project. Technical Services Quarterly. 9 (4):19-28.
________. 1995. The reclassification decision: Dewey or Library of Congress? Cataloging and Classification Quarterly. 19 (3/4):169-182.
Compton Ellis, J. 1988. Planning and executing a major bookshift/move using an electronic spreadsheet. College and Research Libraries News. 49 (5):282-287.
Dean, B.C. 1984. Reclassification in an automated environment. Cataloging and Classification Quarterly. 5 (2):1-11.
Greenwood, D. and Shawyer, J. 1993. Moving the British Library - the Book Control System. Aslib Information. 21 (1):28-31.
Lewis, N. and Seago, K. 1999. An automated reclassification project at the University of Kentucky. Cataloging and Classification Quarterly. 28 (4):117-134.
Massonneau, S. 1990. Reclassification and barcoding: a unique opportunity. Collection Management. 13 (1/2):15-37.
McMillan, S. and McMillan, J. 1984. Reclassification and the University of Queensland Library. Australian Academic and Research Libraries. 15 (3):135-142.
Pattie, L.W. 1995. Reclassification revisited: an automated approach. Cataloging and Classification Quarterly. 19 (3/4):183-193.
Roth, D.L. 1980. To classify or not to classify... a rejoinder. The Serials Librarian. 5 (1): 83-85.
Smith, N.R. 1990. A shelf-management model implemented on Multiplan. Information Technology and Libraries. 9 (1):66-73.
Tucker, D.C. 1989. Using a spreadsheet program to shift a journal collection. College and Research Libraries News. 50 (10):904-909.
| Previous | Contents | Next |


 留言列表
留言列表
